Olga Mykhoparkina
You already have the numbers. HubSpot, GA4, your CRM and Stripe are throwing dashboards at you every morning. But do these numbers make your head spin? With so many metrics to choose from, it’s easy to get overwhelmed. Where do you even begin?
With such access to data, the problem becomes not knowing which numbers deserve your attention this week and which ones should be avoided.
This guide skips the formulas you can already pull from any tool you use. Instead, it groups SaaS marketing metrics into five categories that match how your business runs, tells you what’s considered healthy at each stage, and walks through what usually causes each metric to move and what to do about it.
The five categories that matter
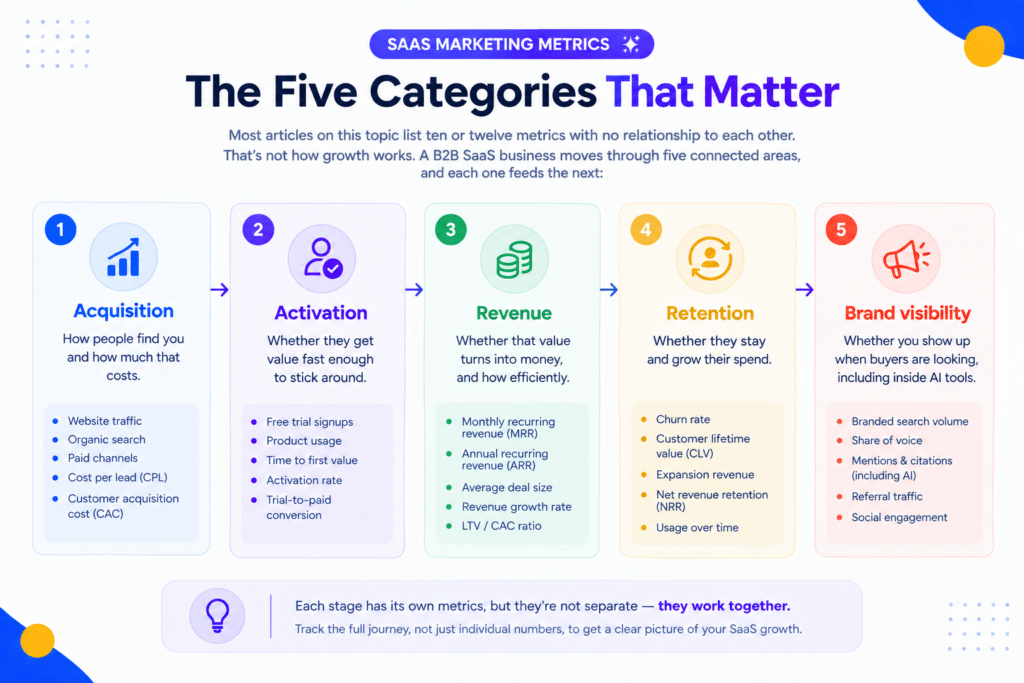
Most articles on this topic list ten or twelve metrics with no relationship to each other. That’s not how growth works. A B2B SaaS business moves through five connected areas, and each one feeds the next:
- Acquisition – how people find you and how much that costs
- Activation – whether they get value fast enough to stick around
- Revenue – whether that value turns into money, and how efficiently
- Retention – whether they stay and grow their spend
- Brand visibility – whether you show up when buyers are looking, including AI tools
We’ll walk you through each one, tell you what matters most at your stage, and give you a plan for when the number moves in the wrong direction.
What to prioritize at each stage
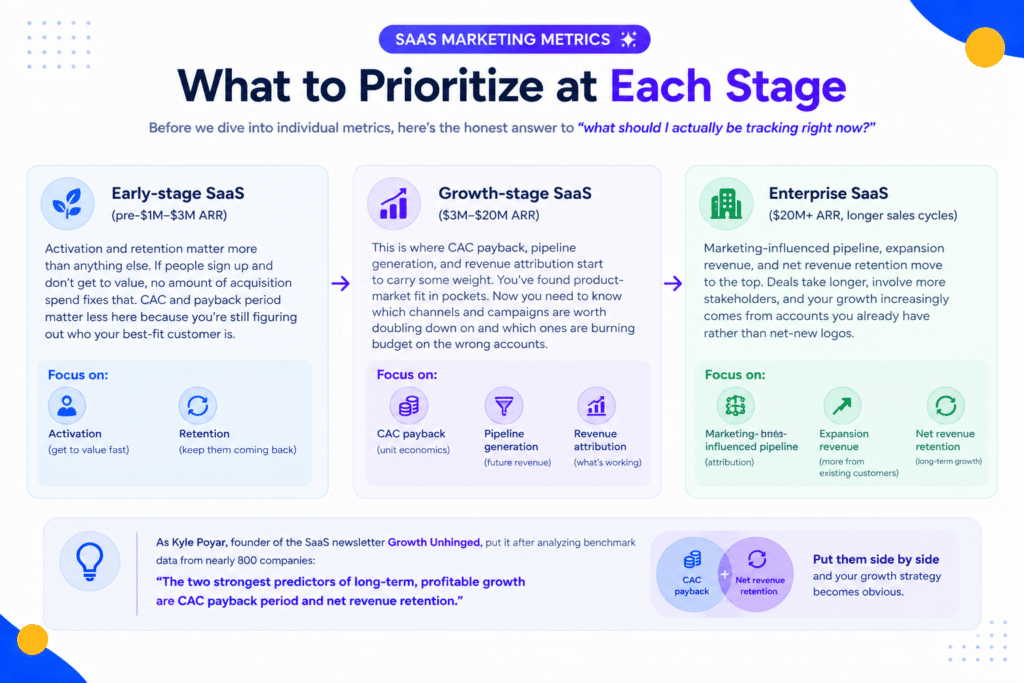
Before we dive into individual metrics, here’s the honest answer to “what should I actually be tracking right now?“
Early-stage SaaS (pre-$1M–$3M ARR): Activation and retention matter more than anything else. If people sign up and don’t get to value, no amount of acquisition spend fixes that. CAC and payback period matter less here because you’re still figuring out who your best-fit customer is.
Growth-stage SaaS ($3M–$20M ARR): This is where CAC payback, pipeline generation, and revenue attribution start to carry some weight. You’ve found product-market fit in pockets. Now you need to know which channels and campaigns are worth doubling down on and which ones are burning budget on the wrong accounts.
Enterprise SaaS ($20M+ ARR, longer sales cycles): Marketing-influenced pipeline, expansion revenue, and net revenue retention move to the top. Deals take longer, involve more stakeholders, and your growth increasingly comes from accounts you already have rather than net-new logos.
As Kyle Poyar, founder of the SaaS newsletter Growth Unhinged, put it after analyzing benchmark data from nearly 800 companies: the two strongest predictors of long-term, profitable growth are CAC payback period and net revenue retention. Most teams look at these two numbers separately. Put them side by side and your growth strategy becomes obvious.
Acquisition: how people find you and what it costs
Qualified traffic (not just visitors)
Unique visitors used to be the first metric on every list like this. These were the number of people who have visited your website or landing page. But it shouldn’t matter anymore. Traffic on its own tells you almost nothing about your business. You can double your visitors and still miss your pipeline target if none of that traffic has commercial intent.
Why it matters: Traffic is a leading indicator, not a result. It’s useful for spotting trend shifts early, but only when you segment it by intent. A visitor landing on your pricing page is worth more than a hundred landing on a glossary post.
What usually causes it to change: Algorithm updates, seasonality, a new competitor entering your keyword space, or a shift in how buyers search (more on AI search below).
What’s healthy: There’s no universal number. What matters is the ratio of qualified traffic to total traffic, and whether that ratio is improving. If commercial-intent pages make up a growing share of your traffic mix, you’re moving in the right direction even if total visitor count is flat.
What to do if it drops: Segment before you panic. Check whether the drop is concentrated in top-of-funnel content or in the pages closer to a buying decision. A dip in blog traffic with stable pricing-page traffic is a very different problem than the reverse.
Customer acquisition cost (CAC)
Customer acquisition cost (CAC) is how much you spend to acquire a new customer, including advertising expenses, promotion events and sales and marketing teams’ salaries. It still matters, but only in context. On its own, it tells you what you spent, not whether that spend was smart.
Why it matters: It’s your baseline for every other efficiency metric. Without it, you can’t calculate payback period or LTV:CAC.
What usually causes it to change: Rising ad costs, a saturated paid channel, sales team growth outpacing new customer volume, or a shift toward more expensive acquisition channels as cheaper ones get maxed out.
What’s healthy: According to the 2026 Aleph × Benchmarkit SaaS & AI Performance Benchmarks, which pulled data from 342 SaaS and AI-native companies, the median B2B SaaS company recovers its CAC in 16 months, while top-quartile companies do it in under 6. That payback window matters more than the raw CAC number, because a $2,000 CAC can be perfectly healthy at a $50,000 ACV and disastrous at a $500 ACV.
Practical scenario: Your CAC increased 30%, but activation stayed flat. Before you increase budget to compensate, check whether branded search declined or whether acquisition moved toward more expensive channels because a cheaper one plateaued. Raising spend on a channel that’s already inefficient just buys you a bigger version of the same problem.
CAC payback period
Why it matters: This is the metric investors and finance teams actually watch, more than CAC alone. It tells you how long your marketing spend is underwater before it turns profitable.
What’s healthy: Under 12 months is generally considered strong, under 18 months is workable for most growth-stage companies, and anything past 24 months usually signals a capital efficiency problem. There’s no single target that applies to every business, though.
In a LinkedIn breakdown of CAC payback, Kyle Poyar laid out a rough guide tied to net revenue retention: below 100% NDR, aim for payback under 12 months; between 100–120% NDR, 12–18 months is reasonable; and at 150%+ NDR, teams tend to get comfortable with a longer payback because expansion revenue closes the gap over time.
Hence, the weaker your retention, the faster you need to recover what you spent to acquire a customer, because you can’t count on that customer sticking around long enough to make up for a slow start.
What to do if it stretches out: Look at your channel mix first. Relying more on paid channels or SDRs usually increases payback time. Then check retention. A longer payback period combined with falling retention is the biggest warning sign.
Activation: whether people get value fast enough to stay
Activation rate
Why it matters: A signup isn’t a customer. Activation tells you whether someone experienced the value your product promised, which is the real predictor of whether they’ll pay and stay.
What usually causes it to change: Onboarding friction, unclear first-run experience, or a mismatch between what your marketing promised and what the product delivers on day one. That last one is more common than people admit. If your landing pages oversell a use case your onboarding doesn’t support, activation suffers even when the product itself is good.
What’s healthy: This varies enormously by product complexity, so benchmark against your own historical trend rather than an industry number. What you’re watching for is direction: is activation improving release over release, or drifting down as you add signups from less-qualified channels?
What to do if it drops: Check your traffic mix before you touch onboarding. A drop in activation rate that coincides with a spike in signups from a broad top-of-funnel campaign often means you’re bringing in the wrong people, not that your onboarding got worse.
Product Qualified Leads (PQLs)
If your product has a free trial, freemium tier, or self-serve motion, product usage tells you more about purchase intent than form fills do.
Why it matters: A PQL – someone whose in-product behavior signals they’re close to a buying decision – converts at a meaningfully higher rate than a lead who just downloaded a whitepaper. Sales teams that get PQL data can prioritize outreach around people who are already getting value, instead of cold-calling everyone who filled out a form.
What usually causes it to change: Product changes that make key actions easier or harder to reach, changes in the type of user signing up, or a change in what “qualified” usage looks like as your product evolves.
What’s healthy: There’s no universal benchmark, because the qualifying actions are specific to your product. What matters is whether marketing and product agree on the definition, and whether that definition gets revisited as the product changes. A PQL definition set a year ago on an older version of your product is probably stale.
What to do next: If PQL volume is healthy but conversion to paid is weak, the definition is likely too loose. If PQL volume is low but the ones you do get convert well, you likely have an activation problem upstream.
Signup to paid conversion
Why it matters: This bridges activation and revenue. It tells you whether the value someone experienced during a trial or free plan was strong enough to pay for.
What usually causes it to change: Trial length, the gap between what the free plan offers and what users need, and how well the paywall appears when users reach the product’s real value.
What’s healthy: Track the trend instead of a single benchmark. If this rate is falling while activation holds steady, the problem usually sits in pricing or packaging rather than the product experience.
What to do if it drops: Look at the time gap between activation and the paywall moment. If people activate and then churn out during the trial before converting, shortening that gap – through faster time to value – usually does more than discounting.
Revenue: whether value turns into money, efficiently
Marketing-influenced and marketing-sourced pipeline
Why it matters: This is often the metric that determines whether marketing gets more budget or gets cut. It answers the question every CFO eventually asks: what did marketing actually contribute to revenue, beyond raw traffic and lead counts?
What usually causes it to change: Sales and marketing alignment on attribution rules (or lack of it), longer sales cycles that push deals across quarters, and changes in how touchpoints get tracked across tools.
What’s healthy: This depends heavily on your GTM motion. Sales-led enterprise businesses often see marketing-sourced pipeline in the 20–40% range, with a much larger share marketing-influenced. Self-serve and PLG businesses can see the majority of pipeline touched by marketing content and product usage before sales ever gets involved.
What to do if it stalls: Check whether your attribution model has quietly broken. Multi-touch attribution degrades as buying journeys stretch across more channels, including AI search, which frequently doesn’t show up cleanly in a CRM. If pipeline contribution looks flat, confirm you’re actually capturing it before assuming marketing’s impact has declined.
CLV:CAC ratio and customer payback
Why it matters: This tells you whether the relationship between what you spend to get a customer and what that customer is worth is actually working. A CAC that looks fine in isolation can still mean a business that loses money on every customer if lifetime value doesn’t clear the bar.
What’s healthy: A ratio of 3:1 is the commonly cited target, meaning customers generate three times what it costs to acquire them. Below that, you’re likely spending inefficiently. Well above 5:1 can sometimes mean the opposite problem: you’re underinvesting in growth and leaving efficient acquisition opportunities on the table.
What to do if it slips: Don’t immediately cut acquisition spend. First, check whether CAC has increased, CLV has dropped, or both. If CLV is falling, the real issue is retention or expansion, not acquisition. Cutting CAC won’t solve it.
Annual and monthly recurring revenue (ARR/MRR)
Why it matters: This is the scoreboard. Every other metric in this guide exists to explain why ARR is moving the way it is.
What usually causes it to change: New customer revenue, expansion from existing accounts, and churn all feed into this number, which is exactly why watching ARR alone tells you almost nothing about what to fix. Two companies can have identical ARR growth with completely different underlying health – one built on strong retention and expansion, the other on a leaky bucket refilled constantly with new logos.
What to do: Don’t look at ARR growth alone. If ARR is growing but NRR is falling, you’re relying more on new customers to grow, and that gets more expensive over time.
Retention: whether they stay and grow their spend
Net revenue retention (NRR)
Why it matters: This has become the single most-watched retention metric in SaaS. It captures churn, contraction, and expansion in one number, which makes it a cleaner signal of business health than churn rate alone.
What usually causes it to change: Product gaps that surface after the honeymoon period, weak onboarding for advanced features that could drive expansion, pricing that doesn’t scale naturally with customer growth, or a customer success team stretched too thin to spot at-risk accounts early.
What’s healthy: According to SaaS Capital’s 2026 benchmarking survey of more than 1,000 private B2B SaaS companies, bootstrapped companies with $3M to $20M in ARR post a median NRR of 103%, with top performers reaching close to 118%. Venture-backed companies at similar stages often report higher medians, partly because usage-based pricing models tend to produce stronger expansion. Anything below 100% means your existing customer base is shrinking before you even count new logos.
What to do if it drops: Resist the urge to throw the whole customer success team at it. Segment first. Is the decline concentrated in a specific plan tier, a specific onboarding cohort, or a specific use case? NRR problems are rarely uniform across your customer base, and treating them as uniform wastes the fix.
Expansion revenue
Why it matters: Expanding an existing customer costs a fraction of what it costs to acquire a new one, which makes this one of the highest-ROI growth levers most marketing teams underinvest in. Marketing teams often treat expansion as a customer success problem and stop paying attention once a deal closes.
What usually causes it to change: Whether customers discover higher-value features or plans on their own, whether your team proactively surfaces upgrade paths as usage grows, and how well product and marketing collaborate on lifecycle messaging after the initial sale.
What to do: Treat expansion as a marketing job, not just a sales or customer success one. In-product messages, lifecycle emails, and content for customers nearing their plan limits should all be part of marketing. But these efforts are often overlooked in favor of top-of-funnel work.
Churn rate
Why it matters: Churn is the leak NRR partly captures, but tracking it separately still matters because it tells you specifically how many relationships you’re losing, independent of what expansion is masking.
What’s healthy: SMB-focused SaaS typically runs higher monthly churn (3-7%) than enterprise SaaS (0.5-1%), which reflects deal complexity and switching costs more than product quality. Compare yourself against businesses with a similar ACV and buyer profile, not the industry average.
What to do if it rises: Look at the timing. Churn concentrated in the first 90 days points to an activation or onboarding failure. Churn that shows up later, after a year or more, more often points to product gaps competitors have closed or a customer that has simply outgrown your product tier.
Brand visibility: whether you show up when buyers are looking
Buyer research has moved well beyond typing a query into Google and clicking through blue links.
Tim Sanders, Chief Innovation Officer at G2, described the shift in G2’s 2026 Answer Economy report: the yellow pages compressed a market into a single book, Google compressed it into a page of results, and now AI chatbots are compressing weeks of research into a single prompt. The same report found that 51% of B2B software buyers now start their research with an AI chatbot more often than with Google, and 71% rely on AI chatbots somewhere in the research process.
That changes what you need to track now.
AI referral traffic and AI visibility
Why it matters: If buyers are asking ChatGPT, Perplexity, or Gemini to shortlist vendors before they ever land on your site, and your brand isn’t showing up in those answers, you’re losing deals you’ll never see in a funnel report. This traffic is currently small in volume but converts at a meaningfully higher rate than average organic traffic, because someone who reached your site through an AI recommendation has already done a round of evaluation.
What usually causes it to change: Whether your content gets cited as a source by AI models, which depends heavily on being referenced on the sites those models pull from most, including review platforms, Reddit, and high-authority publications.
What’s healthy: There’s no mature benchmark yet, since this channel is still new. What you should watch is the trend and the quality of that traffic (time on site, conversion rate) rather than absolute volume.
What to do: Don’t build a whole strategy around this yet, but start tracking it now so you have a baseline. Manually asking ChatGPT or Perplexity the questions a buyer might ask gives you a rough read, but it doesn’t scale and it doesn’t hold up over time. A tool like Allmond, which tracks how often and how prominently your brand shows up across AI models for the prompts your buyers use, gives you a consistent number to watch instead of a one-off screenshot.
Branded search growth
Why it matters: People who search your brand name directly are often people who first heard about you somewhere else, including an AI answer, a review site, a podcast, or a colleague’s recommendation. Branded search growth is one of the cleaner signals that your visibility efforts outside of traditional SEO are working, even when you can’t attribute the exact source.
What to do if it’s flat: Check your presence on review platforms and in AI-cited sources before assuming your brand awareness work isn’t working. A lot of upstream influence never gets attributed cleanly.
Review platform visibility
Why it matters: Review platforms like G2 and Capterra are frequently the sources AI models pull from most when answering software comparison questions, which makes your presence there a factor in both human and AI-driven buying decisions.
What to do: Treat review volume and recency as an active marketing metric. Prompt happy customers for reviews close to a renewal or a positive support interaction, when the experience is fresh.
Product-led growth and self-serve signals
Why it matters: If your business has a self-serve product, the traditional traffic-to-lead-to-customer funnel doesn’t tell the full story. People are using your product before speaking to sales, so product usage data should be part of your marketing metrics.
What to do: Build a shared view between marketing and product on which in-product behaviors correlate with eventual conversion. This is where PQLs, mentioned earlier, become the connective tissue between the two teams.
What we see across SaaS companies we work with
A few patterns show up often enough across the SaaS companies we’ve worked with that they’re worth naming directly.
Traffic growth and pipeline growth often decouple, and teams don’t notice for months. We’ve seen SaaS companies celebrate a traffic milestone in a monthly report while SQL volume stays completely flat. The traffic was real, but it wasn’t the right audience. This is usually a keyword targeting problem: content built around search volume rather than commercial intent brings visitors who were never going to buy.
Executives care about fewer metrics than marketing teams think. In our experience, most founders and CMOs track pipeline contribution, CAC payback, and retention closely, and treat everything else as supporting detail. Teams that build reports around a dozen metrics often lose the executive’s attention before they get to the number that matters.
A healthy-looking activation rate can hide a targeting problem. We’ve seen activation numbers hold steady while the mix of who’s activating quietly shifts toward less commercially viable segments. The rate looks fine. The revenue six months later doesn’t.
Branded search is one of the most underreported wins in SEO. Teams that invest in content, PR, and AI visibility rarely get full credit for the branded search lift that follows, because it doesn’t show up as a direct conversion. It shows up weeks or months later as someone typing your name into Google.
How Quoleady approaches SaaS marketing metrics
If your organic traffic is growing but SQLs remain flat, keyword targeting is often the issue. We help SaaS companies identify searches with commercial intent instead of chasing volume for its own sake. That’s how we took Effy AI from a standing start to 60,000 monthly organic visitors over two and a half years, by targeting long-tail keywords specific to their buyers rather than broad, high-competition terms.
If your activation rate looks healthy but paid conversion is weak, the problem is often further upstream than onboarding. We build content strategy around the questions your buyers ask when they’re close to a decision.
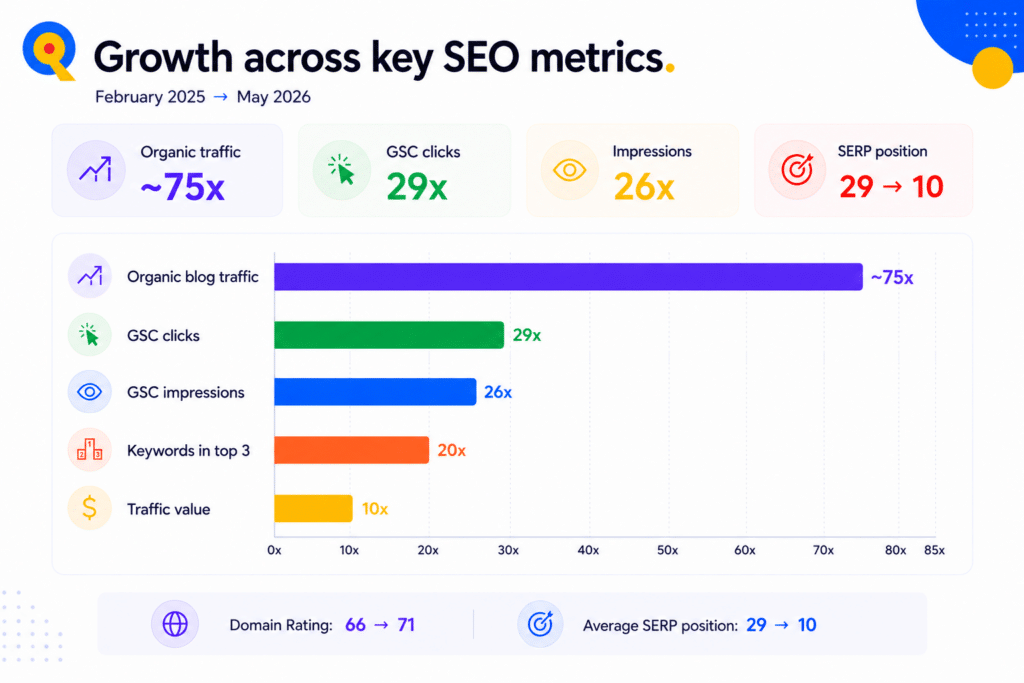
For YouScan, an AI-powered social listening platform, that meant comparison and alternative-focused content built around evaluation moments rather than generic informational posts. Over 15 months, that approach grew organic clicks 29x and got their top-performing page cited in Google AI Overviews dozens of times.
If your brand isn’t showing up when buyers ask AI tools for recommendations, the fix usually starts with the same fundamentals that drive traditional search visibility: strong content, digital PR, and a presence on the review platforms AI models pull from most.
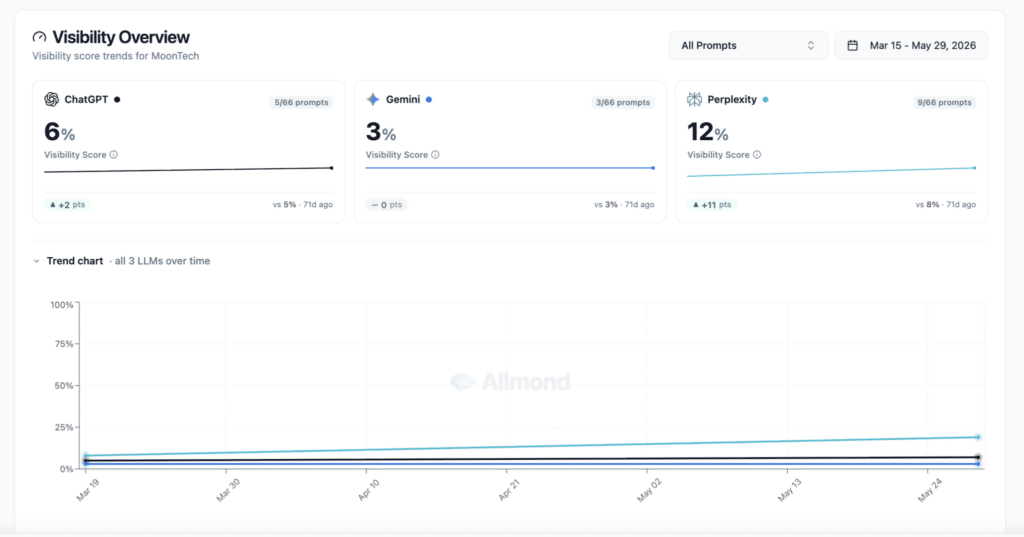
We build strategies that cover both at once. We track the results with our tool, Allmond. For a UAE-based influencer marketing platform, that meant going from no AI visibility at all to a measurable, growing presence across ChatGPT, Gemini, and Perplexity within three months.
If you’re competing in a niche or regional market that most generic SaaS content ignores, the fastest win is to write the content nobody else is focusing on. That same UAE platform was up against competitors sitting at 25 to 33% AI visibility while they were effectively invisible.
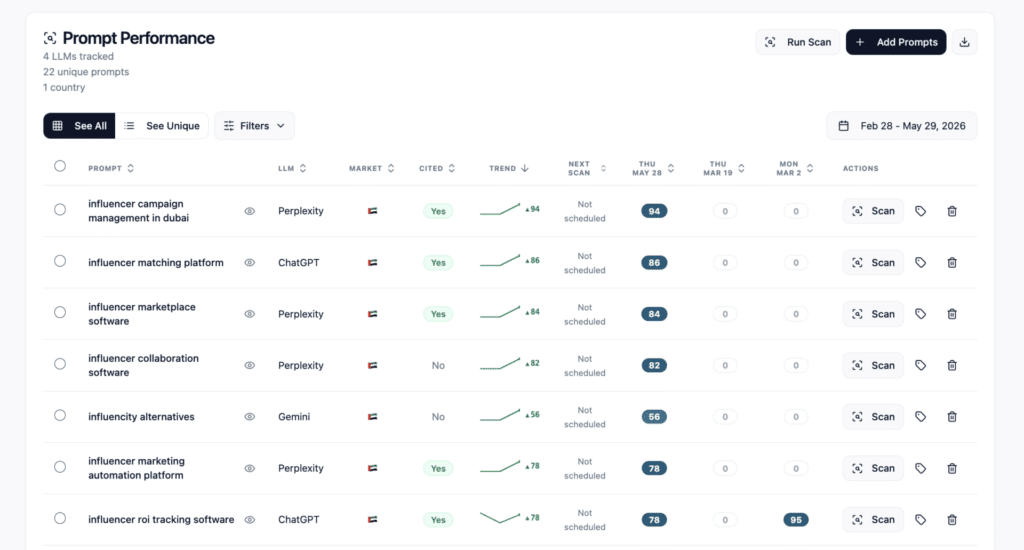
Building out the region-specific content those competitors skip, alongside targeted alternative pages, took their branded search clicks from 3 to 3,400 and organic users from 255 to 10,000 in seven months.
Book a free call with Quoleady if you want a second opinion on which of your metrics deserve attention.
The short version
Tracking every metric equally is the same as tracking none of them closely. Here’s what to hold onto:
- Acquisition: qualified traffic and CAC payback matter more than raw visitor counts or CAC in isolation
- Activation: whether people reach real value fast, tracked through activation rate and PQLs where relevant
- Revenue: CLV:CAC ratio and marketing-sourced pipeline, watched together with ARR rather than instead of it
- Retention: net revenue retention as your single best health signal, with expansion revenue as an active marketing lever
- Brand visibility: branded search, review platform presence, and early tracking of AI referral traffic
These numbers mean little on their own. What matters is understanding what changed, why it changed, and what you’ll do differently before next month’s report.
Want help choosing the metrics that matter and building a strategy around them? Book a free call with Quoleady. We work exclusively with B2B SaaS companies, and we’d rather help you focus on the three metrics that matter most than give you a dashboard with thirty.
FAQs
What are the most important SaaS marketing metrics to track?
The metrics that matter most depend on your stage. Early-stage SaaS companies should prioritize activation and retention. Growth-stage companies should focus on CAC payback and pipeline generation. Enterprise SaaS should weigh marketing-influenced pipeline and net revenue retention most heavily. No single metric matters equally at every stage.
What is a good marketing ROI for SaaS?
The industry standard is 3:1 CLV:CAC ratio, which means your customer lifetime value (how much your business is expected to generate from a single customer over the course of your relationship) is three times greater than the cost of acquiring a new customer.
What is a good net revenue retention rate for SaaS?
A net revenue retention rate above 100% means your existing customer base is growing before you count new logos. SaaS Capital’s 2026 survey found bootstrapped companies with $3M–$20M ARR post a median NRR of 103%, with top performers near 118%. Venture-backed and usage-based companies often report higher medians.
Should SaaS companies track AI search visibility as a marketing metric?
Research shows that more than half of B2B software buyers now start their research with an AI chatbot more often than with a traditional search engine. So, yes, tracking AI referral traffic and citation visibility should be a part of your marketing metric.