Katarina Stamenković
Content marketing manager

Katarina Stamenković
Jul 15, 2025Do numbers and formulas make your head spin? With so many metrics to choose from, it’s easy to get overwhelmed. Where do you even begin?
Don’t worry. As one of the best SaaS marketing agencies, we have compiled a list of 12 key SaaS marketing metrics that will provide plenty of data to optimize your marketing efforts without overwhelming you. Plus, you’ll learn how to track them even if you’re not a numbers person. Let’s dive right in!
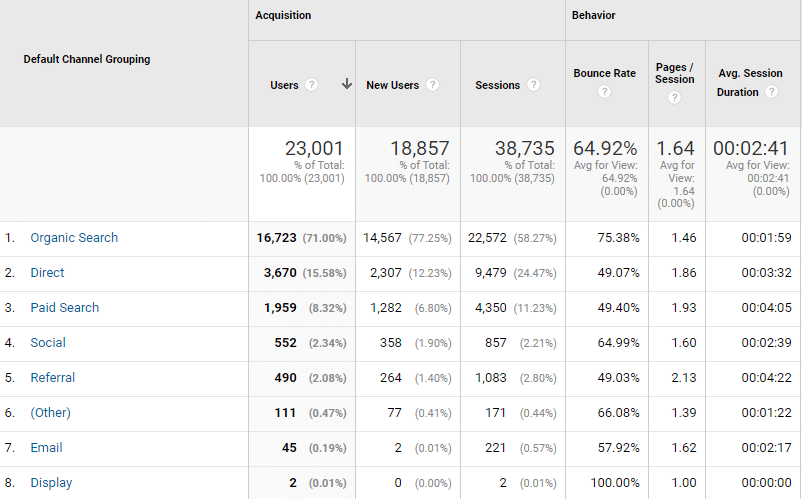
Since SaaS products are primarily digital solutions, SaaS content writing plays a huge part in their success. That’s why you should measure unique visitors or the number of people who have visited your website or landing page.
If someone visits your website multiple times, they still count as one unique visitor, making this metric different from total visitors. Unique visitors can come from various sources, such as:
Knowing which channel brings the most visitors is helpful so you can double down on it.
Google Analytics is a great free tool for monitoring website traffic and visitor behavior. It can tell you how many unique visitors you have, which pages attract the most visitors and where the visitors come from.
Customer acquisition cost (CAC) is how much you spend to acquire a new customer, including advertising expenses, promotion events and sales and marketing teams’ salaries.
Customer acquisition cost = Total marketing and sales costs / Number of new customers acquired
You get CAC by dividing the total cost of your sales and marketing efforts by the number of new customers you acquire over a certain period, such as a month or a quarter.
Suppose you spend $10,000 monthly on sales and marketing and acquire 100 new customers. In that case, your CAC would be:
$10,000 / 100 = $100
Now, you may be wondering what a good CAC is. The average CAC for SaaS depends on your industry but also on whether you’re breaking into a new market, your company’s age and size etc.
Studies show that the average CAC for small-to-medium-size SaaS companies can range from $274 to $1,450, whereas for enterprise companies, it goes up from $2,190 to $14,772, depending on the industry.
To increase CAC, companies should aim for sustainable and organic customer acquisition channels that don’t rely on paid advertising, such as SEO content.
💡 But what if you spend a bit more to acquire a customer, but that customer ends up spending much more than most? This is why the cost of acquiring customers alone can be misleading. You need to combine this metric with CLV to get more accurate data.
Customer lifetime value (CLV or CLTV) is the expected revenue one customer will generate for your company throughout their lifespan as your customer.
Customer lifetime value = Customer value x Average customer lifespan
You get your CLV by multiplying customer value by the average customer lifespan. Let’s break down this formula further:
Customer value = Average purchase value x The average number of purchases
Average purchase value = Total revenue / Number of orders
The average number of purchases = Number of purchases / Number of customers
Average customer lifespan = Sum of customer lifespans / Number of customers
You can improve your CLV by:
Now we can introduce the CLV:CAC ratio, which is more helpful than CAC and CLV alone. It indicates whether your sales and marketing strategy is paying off. Divide your CLV by your CAC to get your ratio.
Let’s say your CLV is $300 and your CAC is $100. Your ratio calculation would then be:
CLV:CAC = CLV / CAC
CLV:CAC = 300 / 100
CLV:CAC = 3
Therefore, your ratio would be 3:1. A ratio of 3:1 or higher is considered good because it means the customers bring you three times greater profit than you’re spending on acquiring them.
A high CLV:CAC ratio means your marketing efforts are paying off and you are getting a good return on investment (ROI).
Source: Community HubSpot
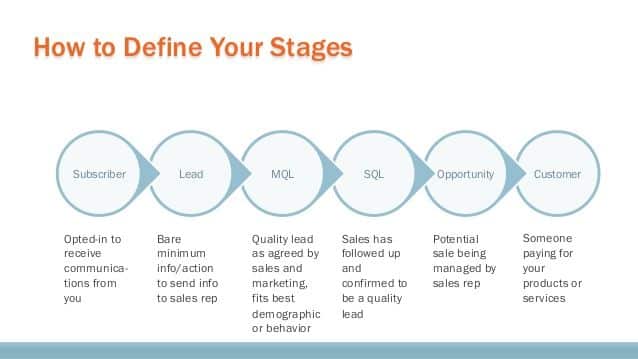
Not all leads are equally qualified. There are two categories of qualified leads:
Separating your leads will help you determine the following steps to push your prospects further down the funnel and boost conversion rates. You can use marketing automation tools to classify leads based on their actions on your website.
While signups show the number of users signing up for your product, activations refer to the number of users completing the signup process and taking the necessary steps to start using your product.
Activation doesn’t necessarily mean they are paying for it. Perhaps you offer a free trial or plan – someone can still activate and use your product even if they haven’t paid for it.
Activation rate = (Number of activated users in a given period / Number of signups in a given period) x 100
To get your activation rate, divide the number of activations in a given period by the number of signups in that period and multiply that number by 100.
Let’s say 100 users sign up for your product and 50 complete the necessary steps to activate their account. The activation rate would then be:
(50 – 100) x 100 = 50%
Why is this metric useful? It helps you see if you’re generating enough interest in the product to drive sales or if your onboarding needs improvements. To improve your activation rate, you can design a personalized onboarding to convince those who sign up to activate.
The activation rate is also fantastic for scaling paid advertising. You can put this metric into your paid marketing algorithm as a conversion goal and target those likely to use and invest in your product rather than sign up only.
This metric is helpful for those businesses offering free trials or free plans. If you don’t, skip this and proceed to the next metric.
Perhaps your acquisition efforts get you signups and activations, but that still doesn’t mean paying customers.
The signup to paid conversion rate measures the percentage of users who convert to paying customers after signing up for a free trial or freemium. It helps you predict paid conversions from signups.
Signup to paid conversion rate = (Number of paying customers in a given period / Number of signups in a given period) x 100
Divide the number of paying customers in a given period by the number of signups in that same period and multiply that number by 100. If you had 500 users last month sign up for a free trial and out of those 500 signups, 100 converted to paid plans, your signup to paid conversion rate would be:
(100 / 500) x 100 = 20%
You should analyze how long it takes someone to convert into a paying customer and try to close the time gap between free trials or freemiums and paid plans.
The lead-to-customer rate measures the percentage of leads that convert into paying customers.
What is considered a lead can vary depending on the industry and business. It generally includes users expressing some level of interest in your product, for example, by filling out a form, subscribing to your newsletter or downloading an ebook.
Lead-to-customer rate = (The number of customers acquired over a certain period / The number of leads generated in that period) x 100
Divide the number of customers you acquired over a specific period by the number of leads you generated and multiply that number by 100. If you generated 1000 leads from which 300 turned to customers, your lead-to-customer rate would be:
(300 / 1000) x 100 = 30%
Calculating a lead-to-customer rate can help you gain valuable insights into your marketing campaigns and their effectiveness in turning leads into customers.
Lead velocity rate (LVR) refers to the percentage of your leads’ growth from month to month, measuring whether your marketing strategies are inspiring growth and determining growth potential.
To simplify the formula, we’ll make two distinctions:
Lead velocity rate = (A – B) / B x 100
Subtract the total number of leads from the previous month from the total number of leads from the current month, divide that result by the total number of leads from the last month and multiply by 100 to get a percentage.
Imagine you generated 500 leads in March and 600 leads in April. What is the lead velocity rate in that case?
(600 – 500) / 500 x 100 = 20%
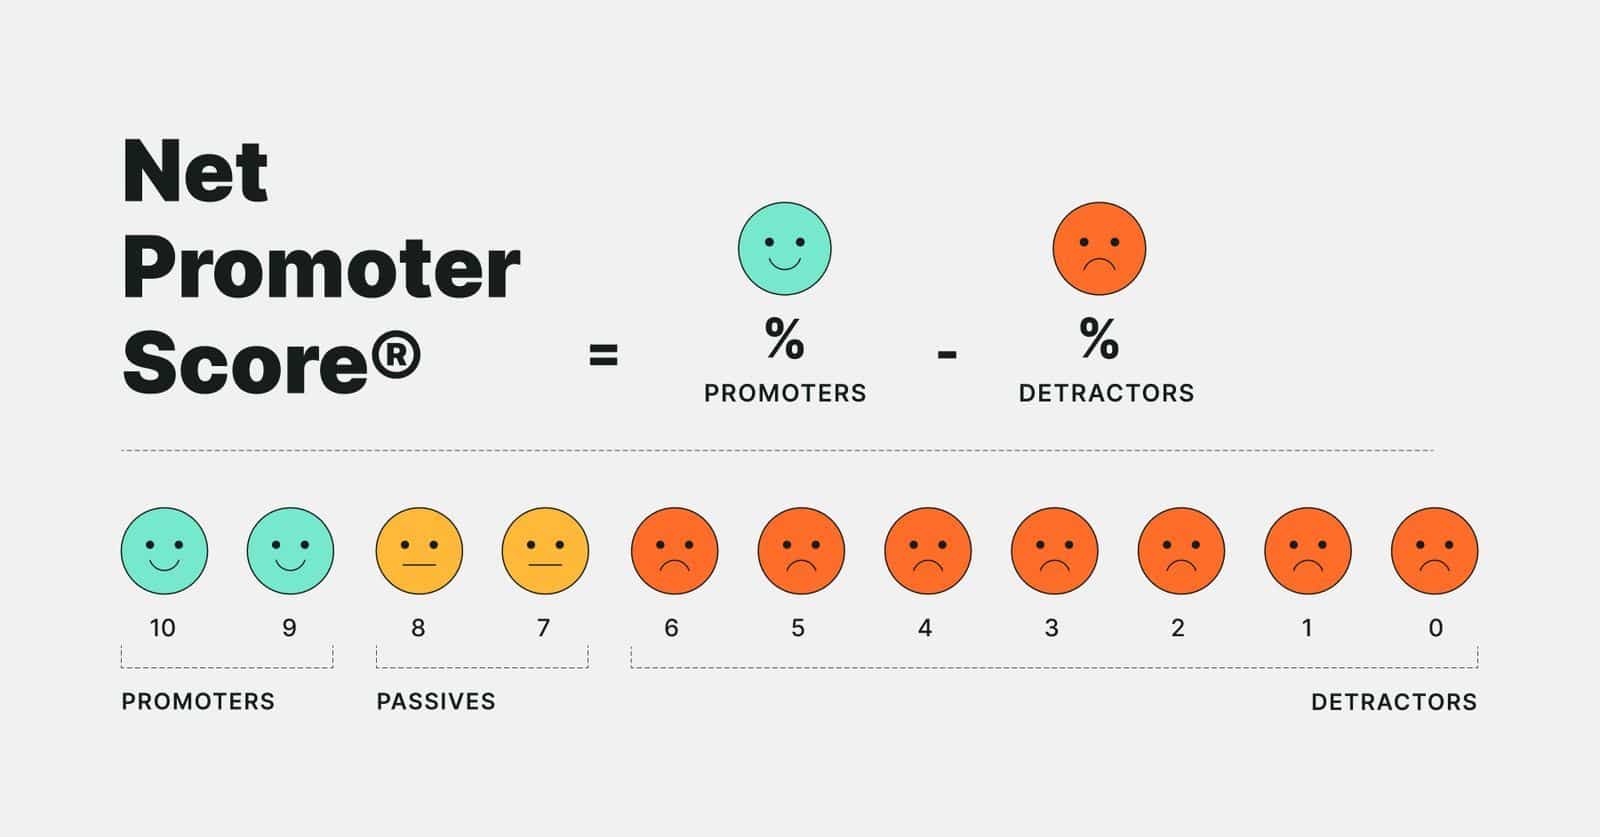
Image source: mTab
Net Promoter Score (NPS) measures how likely customers are to recommend your company to the people they know. You get your score by first asking the question:
On a scale from 1-10, how likely are you to recommend our company to someone you know?
Depending on the score they give, customers are classified as:
NPS = % of promoters – % of detractors
To calculate NPS, you first need to calculate the percentage of promoters and detractors among your respondents. You can do this using these formulas:
% of promoters = (Number of promoters / Total number of respondents) x 100
% of detractors = (Number of detractors / Total number of respondents) x 100
Let’s say you have 600 respondents, out of which 100 detractors and 300 promoters. Here is how you get NPS:
% of promoters = (300 / 600) x 100 = 50%
% of detractors = (100 / 600) x 100 = 16.67%
NPS = 50% – 16.67% = 33,33%
NPS score provides insight into whether you have a loyal customer base, but you shouldn’t stop at asking that one question. Delve deeper and ask further questions to determine why you’re getting those scores and how to improve them.
There are two types of churn rates:
Customer churn rate refers to the percentage of customers who cancel their subscriptions over a specific period. It helps determine the success of your customer retention efforts.
Customer churn rate = (Number of customers lost over a certain period / Number of customers at the start of that period) x 100
For example, if you lost 100 customers over a certain period and had 1000 customers at the beginning of the period, your customer churn rate would be:
(100/1000) x 100 = 10%
However, not every customer brings equal revenue. That’s why you also need to calculate your revenue churn rate.
Revenue churn rate measures the revenue lost due to customer churn over a specific period.
Revenue churn = (Revenue lost from existing customers over a specific period / Total revenue at the beginning of the period) x 100
For example, if your company generated $500,000 in revenue during a quarter and lost $50,000 in revenue during that same quarter due to customer churn, the revenue churn rate for that quarter would be:
($50,000 / $500,000) x 100 = 10%
Product marketers and customer success teams need to work together to improve the churn rate. You can:
Annual Recurring Revenue (ARR) and Monthly Recurring Revenue (MRR) refer to the total revenue your business generates on a monthly or annual basis.
MRR = Total number of monthly customers x Average revenue per user
ARR = MRR x 12
Higher ARR is the ultimate goal of any marketing or sales activities. Of course, many factors apart from marketing affect this metric, such as the work of a product, support and sales teams. The marketing team can help grow ARR by working effectively with other departments.
Quoleady is a SaaS blog writing company and SaaS SEO agency. Our team of SaaS content marketers can help you generate qualified leads, increase the number of unique visitors and ultimately affect your ARR through organic marketing. How?
Even if you don’t have a SaaS business yet, you’re considering buying a SaaS business, or starting one, we’d love to hear from you anyway and discuss how we can help when the time’s right.
Schedule a free call today and learn more about how Quoleady can help your SaaS business grow!
With the right data, you can measure your way to sustainable growth in the competitive SaaS market. Here are the 12 key metrics to track:
However, it’s not enough to track the numbers – acting on the data is essential to make it worth your while. Regularly analyze your metrics, identify areas for improvement and adjust your strategies accordingly. Happy tracking!
Marketing metrics for a SaaS company refer to the metrics a SaaS business tracks to measure the success of its marketing efforts.
The key marketing metrics of B2B SaaS include:
The industry standard is 3:1 CLV:CAC ratio, which means your customer lifetime value (how much your business is expected to generate from a single customer over the course of your relationship) is three times greater than the cost of acquiring a new customer.
Research shows that, on average, SaaS businesses spend 10% of their ARR on marketing. Of course, it depends on the industry and business size. We are at your disposal for B2B copywriting services.
Katarina Stamenković
Content marketing manager
Read also


At Quoleady, we’ve worked with more than 200 B2B SaaS companies, from early-stage startups to

Olga Mykhoparkina
Jul 10, 2026
I often see teams paying for 15–20 different marketing tools while still struggling to publish con
Olga Mykhoparkina
Jun 30, 2026
High-quality content can help you improve your brand authority, increase traffic, attract leads and

Ardak Yeshniyazova
Jun 15, 2026 Let us know what you are looking to accomplish.
We’ll give you a clear direction of how to get there.
All consultations are free 🔥